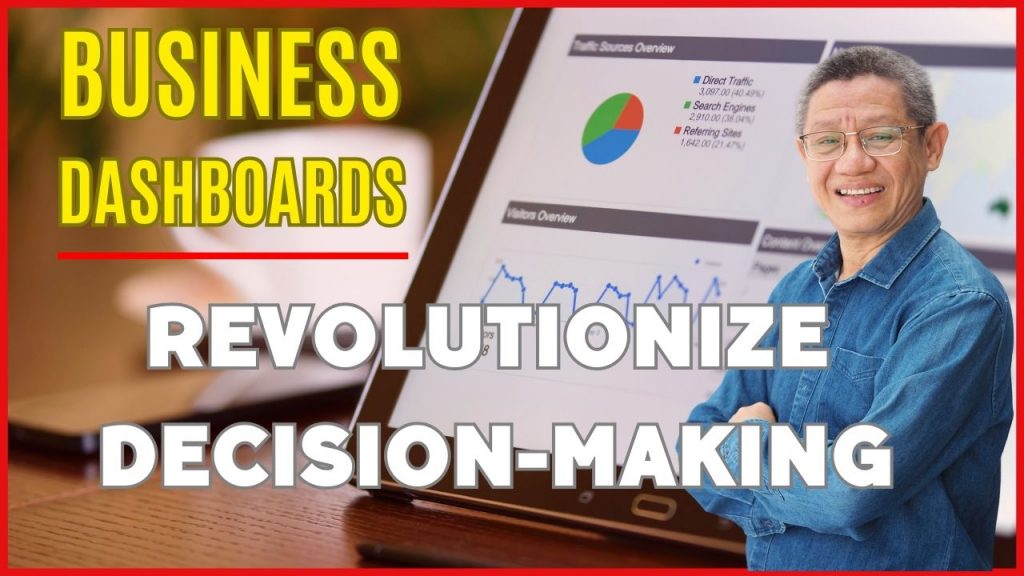
Unlocking Success: How Business Dashboards Revolutionize Decision-Making

In today’s fast-paced business environment, making informed decisions is crucial for success. However, with the abundance of data available, it can be challenging to extract meaningful insights and make sense of it all. This is where a business dashboard comes into play.
A business dashboard is a powerful tool that provides a visual representation of key business metrics and data, enabling decision-makers to monitor performance, identify trends, and make data-driven decisions. In this article, we will explore the concept of a business dashboard, its benefits, key features, types, implementation strategies, best practices, and common challenges. So, let’s dive in!
In this digital age, businesses have access to vast amounts of data. However, without an effective way to analyze and interpret this data, it becomes overwhelming and hinders decision-making processes. This is where a business dashboard can be a game-changer. A business dashboard is a centralized platform that consolidates data from various sources and presents it in an easily understandable format, such as charts, graphs, and visualizations.
What is a Business Dashboard?
A business dashboard is a visual representation of real-time data that provides an overview of key performance indicators (KPIs) and metrics relevant to a specific business or department. It offers a snapshot of the current state of the business and helps stakeholders quickly grasp the overall performance at a glance. With a well-designed dashboard, users can track progress, identify trends, and gain actionable insights to drive informed decision-making.
Benefits of a Business Dashboard
1. Improved Decision-Making
One of the primary benefits of using a business dashboard is that it facilitates better decision-making. By presenting data in a visually appealing and easily understandable manner, decision-makers can quickly identify patterns, trends, and outliers. This empowers them to make data-driven decisions based on accurate and up-to-date information.
2. Enhanced Performance Monitoring
A business dashboard enables real-time monitoring of key metrics, allowing businesses to track their performance against targets and goals. With instant access to critical information, organizations can identify areas of improvement, take corrective actions, and optimize their operations for better outcomes.
3. Increased Transparency and Collaboration
By sharing a business dashboard with relevant stakeholders, such as executives, managers, and team members, organizations foster transparency and encourage collaboration. Everyone can access the same data and metrics, align their efforts, and work towards common goals. This promotes a data-driven culture and improves overall organizational efficiency.
4. Time-Saving and Efficiency
Analyzing large datasets manually can be time-consuming and prone to errors. With a business dashboard, data is automatically collected, processed, and presented in a visually digestible format. This saves time, reduces the risk of human errors, and allows users to focus on analyzing insights rather than gathering data.
5. Flexibility and Customization
Business dashboards offer flexibility and customization options, allowing users to tailor the visualizations and metrics to their specific needs. Whether it’s filtering data, creating personalized reports, or setting up alerts for specific thresholds, users can configure the dashboard to suit their preferences and requirements.
Key Features of a Business Dashboard
To be effective, a business dashboard should possess certain key features:
1. Real-Time Data Updates
A business dashboard should provide real-time or near real-time data updates to ensure that the insights and metrics displayed are current and accurate. This allows decision-makers to stay informed about the latest developments and make timely decisions.
2. Visual Data Representation
Visual elements such as charts, graphs, and gauges make data more digestible and easier to comprehend. A good business dashboard utilizes effective visualizations to present complex data in a simple and intuitive manner.
3. Customizable Widgets
A business dashboard should offer customizable widgets that allow users to choose the specific metrics and data they want to monitor. This flexibility ensures that each user can focus on the metrics that are most relevant to their role and responsibilities.
4. Drill-Down Functionality
The ability to drill down into detailed data is essential for a business dashboard. Users should be able to click on a specific metric or visualization to access more granular information, helping them understand the underlying factors driving the observed trends or performance.
Types of Business Dashboards
Business dashboards come in various types, each catering to different needs and requirements. Here are some common types of business dashboards:
1. Executive Dashboard
An executive dashboard provides a high-level overview of the organization’s performance, focusing on key metrics and strategic goals. It helps executives monitor the overall health of the business and make informed decisions based on key performance indicators.
2. Sales Dashboard
A sales dashboard focuses on sales-related metrics, such as revenue, sales targets, conversion rates, and customer acquisition. It provides insights into the sales pipeline, identifies sales trends, and helps sales teams track their progress toward goals.
3. Marketing Dashboard
A marketing dashboard tracks marketing efforts and measures the effectiveness of marketing campaigns. It includes metrics such as website traffic, lead generation, conversion rates, social media engagement, and return on investment (ROI). Marketers can use this dashboard to optimize their strategies and allocate resources effectively.
4. Financial Dashboard
A financial dashboard provides an overview of an organization’s financial performance, including metrics like revenue, expenses, profitability, cash flow, and financial ratios. It helps finance professionals and executives monitor financial health, identify trends, and make data-driven financial decisions.
5. Operational Dashboard
An operational dashboard focuses on operational metrics and helps teams monitor and optimize their day-to-day activities. It may include metrics related to production, inventory, supply chain, customer support, and process efficiency. This dashboard enables teams to identify bottlenecks, streamline operations, and improve productivity.
In conclusion, a business dashboard is a powerful tool that enables organizations to make data-driven decisions by providing a visual representation of key metrics and data. By leveraging the benefits of real-time data updates, visual data representation, and customizable widgets, decision-makers can monitor performance, identify trends, and gain actionable insights.
With various types of business dashboards available, organizations can choose the one that aligns with their specific needs and requirements. By following best practices and overcoming common challenges, businesses can successfully implement and utilize a business dashboard to drive better decision-making and achieve their goals.
At iLearnFromCloud.com, our Virtual Chief Technology Officer (e-CTO) brings a wealth of experience and technical expertise to help organizations maximize the value of their business dashboards. Our e-CTO works closely with your team to align your company’s business goals with the dashboard’s design, functionality, and data integration.
With a deep understanding of your industry and technological landscape, our e-CTO ensures that the dashboard is tailored to your specific needs, enhancing its efficiency and effectiveness. By leveraging our expertise and collaborative approach, our e-CTO can guide you in harnessing the full potential of your business dashboard, driving data-driven decision-making, and achieving your organizational objectives.
FAQs About Unlocking Success: How Business Dashboards Revolutionize Decision-Making
Q: What is a business dashboard?
A business dashboard is a visual representation of real-time data that provides an overview of key performance indicators (KPIs) and metrics relevant to a specific business or department.
Q: What are the benefits of using a business dashboard?
Using a business dashboard offers several benefits, including improved decision-making, enhanced performance monitoring, increased transparency and collaboration, time-saving and efficiency, and flexibility and customization.
Q: What are some common types of business dashboards?
Common types of business dashboards include executive dashboards, sales dashboards, marketing dashboards, financial dashboards, and operational dashboards.
Q: How do I choose the right business dashboard for my organization?
To choose the right business dashboard, consider factors such as the metrics and KPIs you want to monitor, integration capabilities, user-friendliness, and scalability.
Q: What are some best practices for using a business dashboard?
Some best practices for using a business dashboard include defining clear goals, keeping it simple and relevant, regularly updating and reviewing the dashboard, fostering data literacy, and encouraging collaboration.
Q: What are some common challenges in implementing a business dashboard?
Common challenges in implementing a business dashboard include data quality and integration issues, user adoption and engagement, dealing with an overwhelming amount of data, security and privacy concerns, and technical challenges.
Take Action NOW!
Unleash the full potential of your business with our game-changing eCTO services at https://www.ilearnfromcloud.com/shop/cto.
Discover the transformative capabilities of our e-CTO and how it can effectively support your IT company‘s growth. Learn more: https://bit.ly/IT_Partner
Discover How Our e-CTO (Virtual CTO) Drives Explosive SME Business Growth | Learn More: https://bit.ly/CTO-for-SME


